Program of International Student Assessment (PISA) Statistics
All statistics used to create the figures that follow were obtained from the National Center for Education Statistics, Program for International Student Assessment, https://nces.ed.gov/surveys/pisa/.
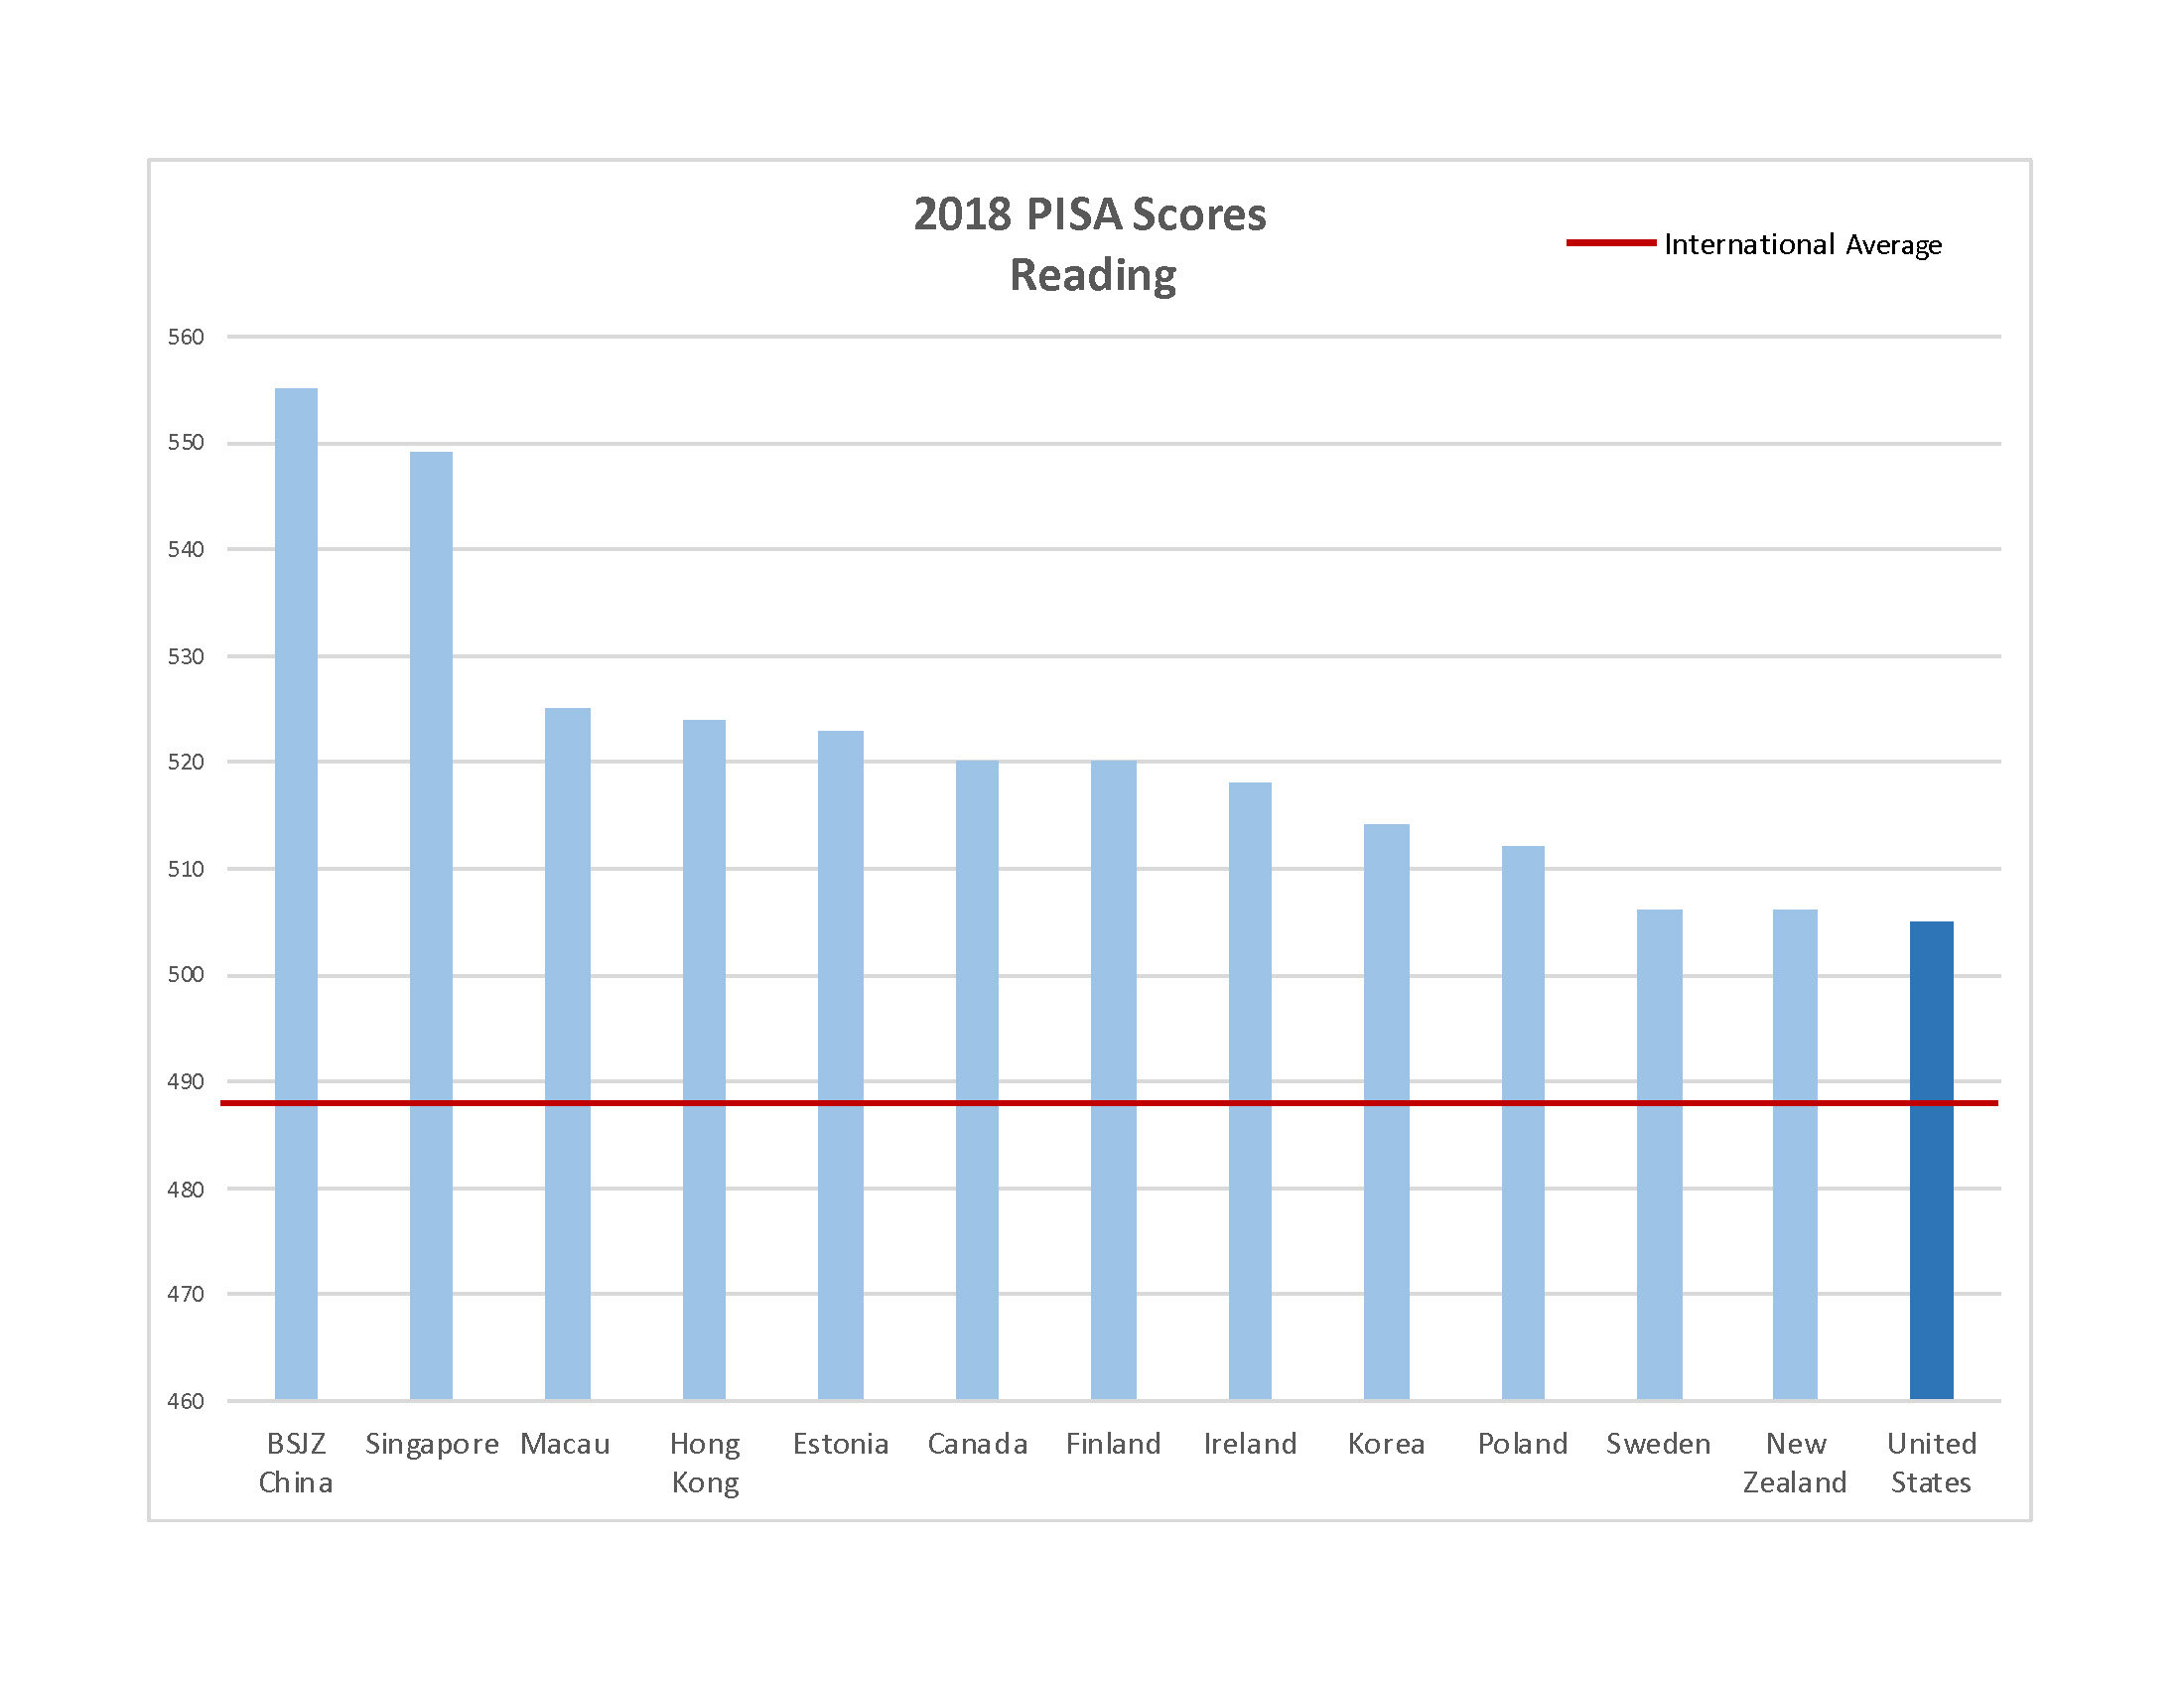
This figure reflects reading scores obtained on the 2018 Program of International Student Assessment (PISA) for the U.S. and all countries that scored higher than the U.S. Average test score appears on the vertical axis and country on the horizontal axis. The red horizontal line reflects the international average score on the test.
This figure shows that the U.S. ranked 13th in Reading on the 2018 PISA and obtained an average PISA score that was only slightly higher than the international average, which indicates that American students struggle to compete on international tests of academic competency.

This figure reflects average math scores obtained on the 2018 Program of International Student Assessment (PISA) for the U.S. and all countries that scored higher than the U.S. Average test score appears on the vertical axis and country on the horizontal axis. The red horizontal line reflects the international average score on the test.
This figure shows that the U.S. ranked 37th in Math on the 2018 PISA and obtained an average PISA score that was well below the international average, which indicates that American students struggle to compete on international tests of academic competency.

This figure reflects science scores obtained on the 2018 Program of International Student Assessment (PISA) for the U.S. and all countries that scored higher than the U.S. Average test score appears on the vertical axis and country on the horizontal axis. The red horizontal line reflects the international average score on the test.
This figure shows that the U.S. ranked 18th in science on the 2018 PISA and obtained an average PISA score that was only slight above the international average, which indicates that American students struggle to compete on international tests of academic competency.

This figure reflects scores obtained for the U.S. across the last three administrations of the Program of International Student Assessment (PISA) in reading, math and science. The PISA for reading was administered in 2000, 2015 and 2018. The PISA for math was administered in 2003, 2015 and 2018. The PISA for science was administered in 2006, 2015, and 2018. The vertical axis reflects the average PISA score obtained with U.S. students and the horizontal axis reflects the year the test was administered, and the academic domain tested. The figure is divided to reflect cut-off scores for six proficiency levels included in the PISA. Level 2 reflects low levels of proficiency. Levels 3 and 4 reflect average levels of proficiency. Levels 5 and 6 reflect high levels of proficiency.
This figure shows that, for two decades, American students have scored well below the highest levels of proficiency in reading, math and science. American students barely exceed the bottom of Level 3 for reading and science and have never exceeded Level 2 for math. These shocking statistics indicate that the U.S. educational system consistently fails to produce even basic levels of proficiency with a majority of students.

This figure reflects scores obtained with U.S. students on the Program of International Student Assessment (PISA) across different racial/ethnic groups in reading, math and science. The vertical axis reflects the average PISA score obtained with U.S. students and the horizontal axis reflects racial/ethnic group. The darkest blue bars reflect average reading scores. The lighter blue bars reflect average math scores. The lightest blue bars reflect average science scores.The figure is divided to reflect cut-off scores for six proficiency levels included in the PISA. Level 2 reflects low levels of proficiency. Levels 3 and 4 reflect average levels of proficiency. Levels 5and 6 reflect high levels of proficiency.
This figure shows that students across all racial/ethnic groups are below the highest levels of proficiency in essential academic areas. No group achieved average PISA scores above Level 3. This figure also shows that students of color are being tragically failed by our nation’s schools. Hispanic and black students did not achieve average PISA scores above Level 2 – indicating low levels of proficiency in math, reading and science. Moreover, on average, black students scored below Level 2 in math. These statistics not only indicate the overwhelming failure of our nation’s schools regardless of racial/ethnic group, but also demonstrate the tragic inequity in educational opportunities available for students of color in America.

This figure reflects the number of countries with average scores at each of the different proficiency levels for the 2018 Program of International Student Assessment (PISA). The vertical axis reflects number of countries and the horizontal axis reflects proficiency level. Levels 1c through Level 2 reflect low levels of proficiency. Levels 3 and 4 reflect average levels of proficiency. Levels 5 and 6 reflect high levels of proficiency. The darkest blue bars reflect reading levels, the lighter blue bars reflect math levels, and the lightest blue bars reflect science levels.
The figure shows that a majority of countries obtained average PISA scores at Level 2 for reading and science. This finding indicates that educational systems in more than 30 countries produce low levels of proficiency with a majority of their students in essential academic areas. More than 25 countries achieved average scores at Level 3 for reading, math and science –indicating that their educational systems produce low average levels of proficiency. Less than 5 countries achieved average PISA scores at Level 4 for reading, math and science, which reflect high average levels of proficiency. No country included in the 2018 PISA obtained average scores at the highest levels of proficiency. However, more than 15 countries achieved average scores reflecting the lowest levels of proficiency (Levels 1b and 1a).
These alarming statistics indicate that education systems around the globe are failing to effectively educate a majority of students. No country is producing the highest levels of proficiency with a majority of students and many countries are failing to produce even average levels of proficiency. The educational crisis reflects a global issue not just an American one.